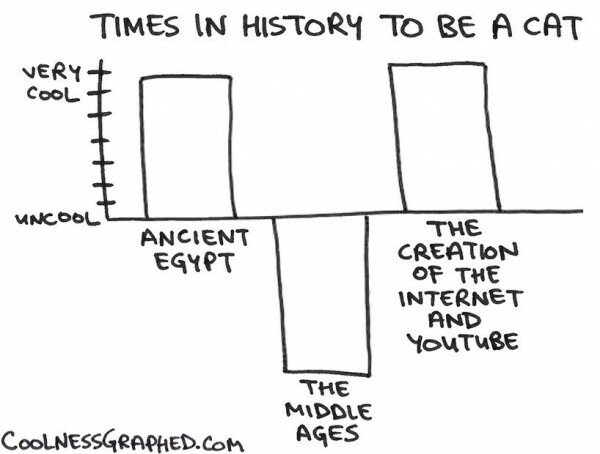
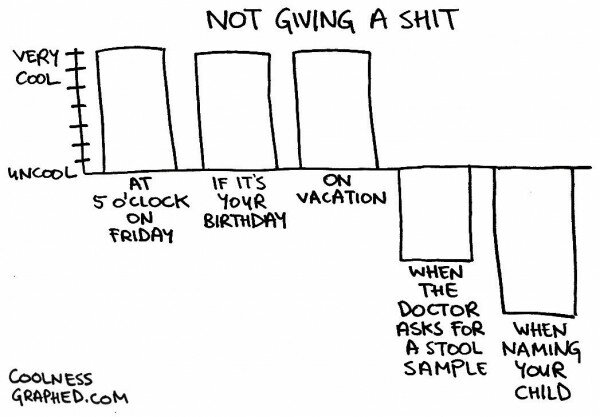
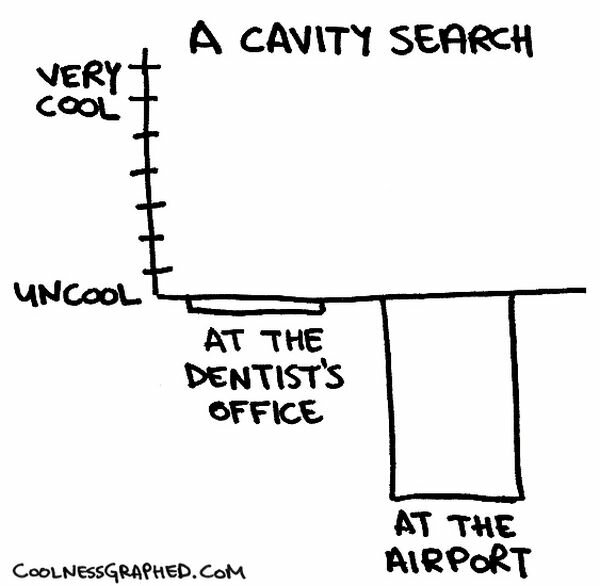
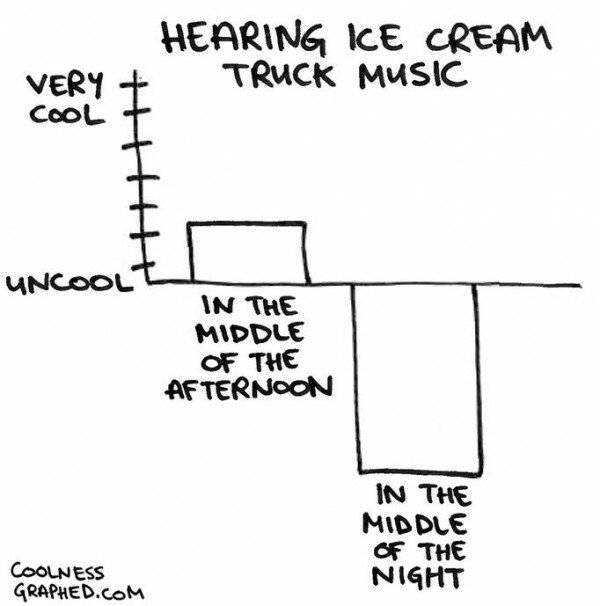
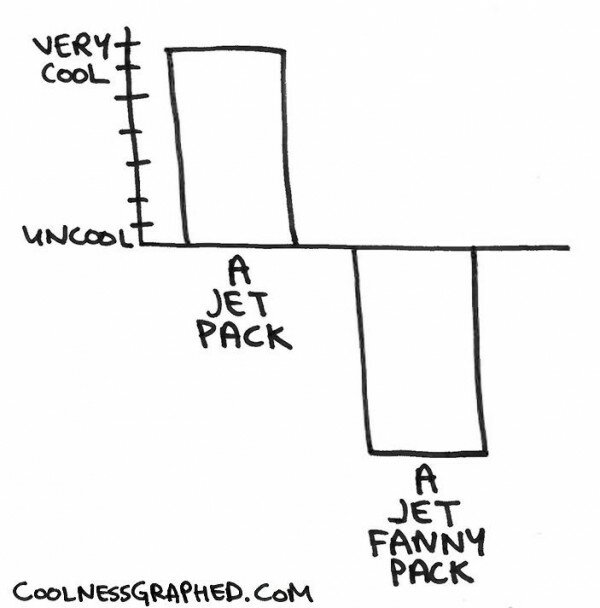
Graphing what’s cool and what is so very uncool

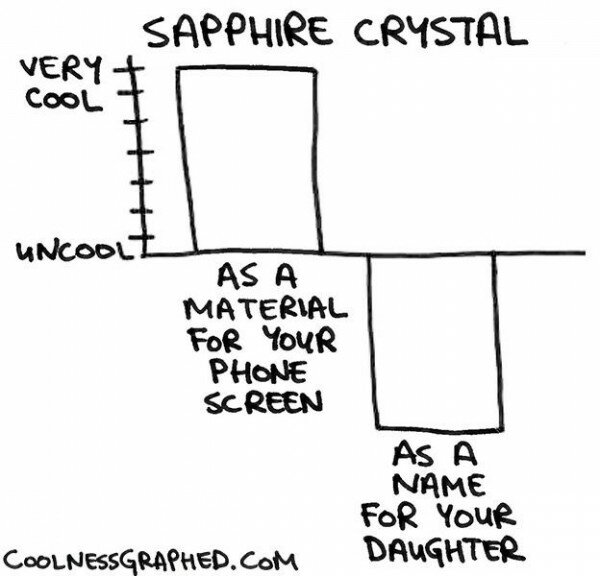
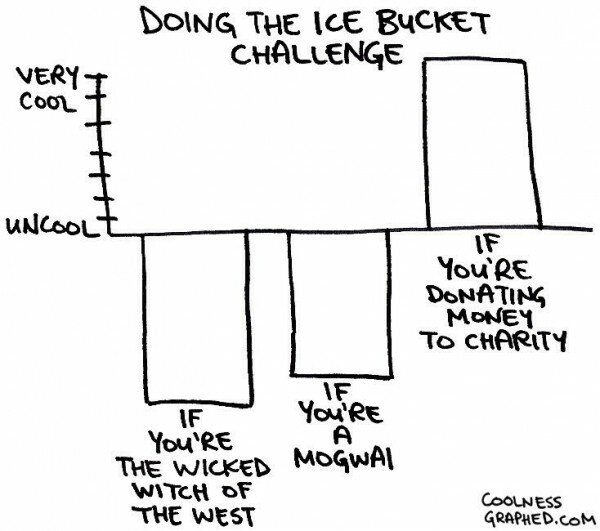
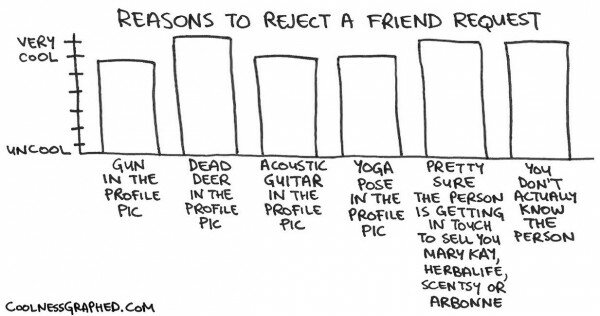
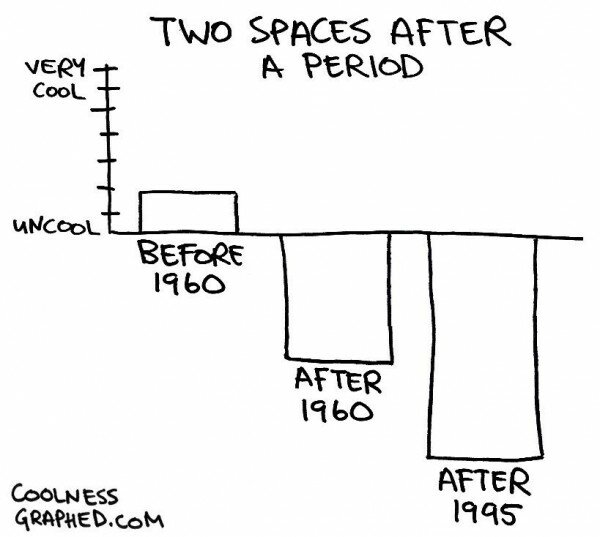
It’s always good to know what’s cool, and what’s not. The easiest way to get around to that, is by seeing a graph. Well now, graphs about the coolness of several things are not so very easily available, but the persevering find a way. Or, you could just rely on these humorous graphs by RC Jones. The website Coolness Graphed has a series of bar charts dedicated to defining what’s cool, and what’s not. A selection of these bar charts has also become a book, now available on Amazon.
Advertisement
Suggested via the Randommization Contact page.